
(This is part of an ongoing discussion of the 2018 OSR Survey results. See the table of contents at the bottom of this post for links to the other parts.)
Earlier, I reported the OSR ratings of various games (as in, level of agreement with the statement: I think the game ________ is OSR) and also which games respondents reported playing. As I noted in that post, these variables allowed me to score individual responses on degree of OSR play behavior. Respondents themselves, in aggregate, determined what OSR play behavior entails. In addition to being related to several other variables that you might expect (such as self-declared participation in the OSR, degree of identification with the OSR, and having bought an OSR product), degree of OSR play behavior also positively predicts blogging about tabletop roleplaying games generally and belief that the OSR welcomes diverse voices.
I came up with the idea of scoring respondents on OSR play behavior after designing the survey, so the set of games rated on OSR-ness differs slightly from the set of games respondents could indicate they were currently playing. However, there is a substantial overlap between the two sets. This set of overlapping games contributes to the OSR play behavior score. To create an OSR play score for each respondent, I calculated an average of play scores (playing = 1, not playing = missing value) weighted by game OSR rating, which ranges from 1 to 7. For example, a respondent that indicated playing Vampire: The Masquerade (OSR rating = 1.90) and B/X D&D (OSR rating = 6.14) would have an overall OSR play score of (1.90 + 6.14) / 2 = 4.02. One of the options for currently played games was Home-brew (OSR), which I decided should have an OSR game rating of 7. After all, what game could be more subjectively OSR than one the respondent categorized themselves as Home-brew (OSR)? I determined this scoring scheme prior to looking at any results.
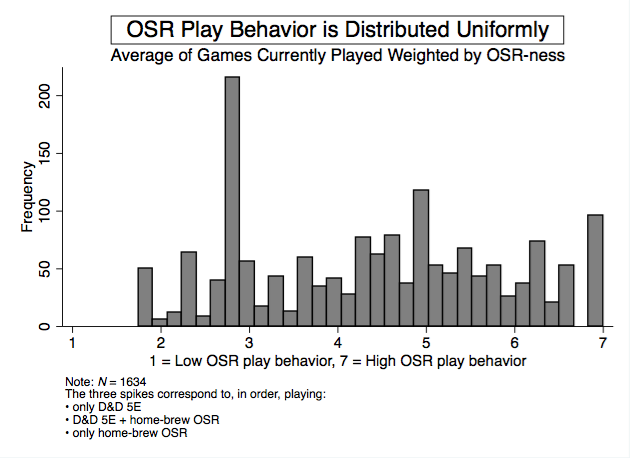
1634 respondents reported currently playing some games for which I had OSR ratings, allowing me to score those responses on OSR play behavior. The mean rating of OSR play among these respondents was 4.41 (SD = 1.44, min = 1.75, max = 7). The distribution of this score was roughly uniform, though there were spikes around 2.87 (n = 198), which corresponds to respondents that reported only currently playing D&D 5E, around 4.93 (n = 64), which corresponds to respondents that reported playing D&D 5E + Home-brew (OSR), and around 7 (n = 96), which corresponds to respondents that reported only currently playing a Home-brew (OSR) game.
This composite play score is obviously imperfect, as respondents indicated play dichotomously rather than by degree, the set of games available to select was incomplete, and the measurement of game OSR-ness was itself imprecise (though derived empirically from the beliefs of respondents). However, the relevant question is whether the rating captures some meaningful variation in degree of OSR play behavior rather than whether it perfectly describes each respondent’s play behavior.
Within sample, the OSR play behavior score has some predictive validity. For example, OSR participants have higher OSR play behavior scores (t(1630) = -18.13, p < .001, MOSR = 4.68, Mnon-OSR = 3.26, using a two-sample t test with unequal variances). Looking at the same relationship another way, I regressed the OSR play behavior score on effects-coded self-declared OSR participation (omnibus F(1, 1628) = 283.61, R2 = .15, b = 1.42, SE = .08, t = 16.84, p < .001, 95% CI [1.25, 1.58]). In English, people who said they participate in the OSR (yes/no) do actually report higher OSR play behavior (the R2 = .15 value means that self-declared participation explains about 15% of the variance in OSR play behavior). Additionally, people with higher OSR play scores were more likely to report having bought an OSR product, according to a logistic regression (b = .51, SE = .07, z = 7.21, p < .001, 95% CI [.37, .65]). This is somewhat exploratory, but strongly suggests the score is capturing some meaningful variation in reported behavior.
Now for some of the more intriguing relationships, such as with blogging (Do you have a blog where you post about tabletop roleplaying games? Yes/No). OSR play behavior positively predicts blogging about any tabletop roleplaying games (b = .32, SE = .06, z = 5.55, p < .001, 95% CI [.21, .43], using a logistic regression). General play behavior, however, measured as the number of different games played, has no relationship to blogging (b = .09, SE = .06, z = 1.55, p = .121). The logistic regression equivalent of R2 is pretty low for this relationship, around 2%, so the importance of the relationship may be small, but the point is comparative: something about OSR play inclines people toward sharing long-form thoughts about tabletop roleplaying compared to just playing a wide variety of games.
Finally, respondents with higher OSR play behavior scores reported the OSR to be more welcoming of diverse voices (omnibus F(1, 1628) = 129.69, R2 = .07, b = .46, SE = .04, t = 11.39, p < .001, 95% CI [.38, .54]). The text of this particular item was: The OSR welcomes diverse voices (1 = Strongly disagree, 7 = Strongly agree; M = 4.79, SD = 1.70, n = 1823). There are a few potential interpretations of this result. Optimistically, people walking the talk (that is, respondents that actually play consensually-defined OSR games) have a more positive view of the degree to which the OSR is welcoming. Pessimistically, there may be some selection bias, as people who feel the OSR is unwelcoming may have been less likely to participate in the survey at all. Anecdotally, I did observe this reaction from a handful of individuals. As a crude robustness check, I arbitrarily changed 50 of the “welcoming” responses (around 2% of the sample) to be 1 (Strongly disagree), simulating absent negative responses, and ran the same analysis again. The result held, suggesting that this sort of selection bias would have minimal effect on aggregate beliefs.
I’m too stupid to understand this result. Does the first spike mean many people say that 5e is an OSR style product?
@Scott
No; the figure shows the distribution of respondent play behavior rated on OSR-ness across responses. You can interpret the midpoint of the scale as something like neutral in terms of game OSR-ness (so neither non-OSR nor OSR). Since D&D 5E has a relatively low OSR-ness rating in the consensual imagination (2 something; check the OSR games post for details), people who only report playing D&D 5E currently get a low OSR play behavior score. That is the highest spike: people who only report playing D&D 5E. The figure is saying something about responses (the behavior of individuals) rather than something about games.
Consider the following structurally similar example from a different domain. Imagine you wanted to quantify the behavior of people regarding the ethnic character of their food habits on a spectrum from white bread American to Chinese (obviously an incomplete and oversimplifying spectrum but bear with me). Assuming a seven point scale, Eating at Denny’s might be 1 (not Chinese at all). Eating at some Thai restaurant might be 5 (somewhat Chinese; yes, there is a cultural difference, but keep in mind the comparison set). Eating at Din Tai Fung in Hong Kong might be 7 (very Chinese). Now record all the places a person actually eats and then average the scores for those places. This average serves as an overall summary of the degree to which the person’s eating behavior involves Chinese cuisine. Replace restaurants with games and Chinese-ness ratings with OSR-ness ratings: that is essentially what I have done in this post.
Does that help?
Also, the figure is really just meant to provide some visual description of the new variable rather than be the focus of the post.
Thanks Brendan!
Pingback: CAR-PGa NEWSLETTER, Vol. 28, No. 3, March 2019 – CAR-PGA
I believe there was a question included in the survey about what type of blog post content folks find most useful. I’d love to see the results of that. Are you planning to address more aspects of the surgery, or have you released the full data, raw or otherwise?
@David
I have a lot more analysis remaining to do.
Regarding attitude toward community-created content, the means across all respondents were:
(Anecdotally, there is a striking disconnect between attitude and behavior regarding gossip, so take that reported attitude with a grain of salt if what you care about is attention and engagement.)
Also, looking item by item, identifying with the OSR is positively related to liking all kinds of content. I created an aggregate liking for community content variable by averaging attitudes toward all eleven items, and people who identify with the OSR like community content in general more (R-squared = .17, F(1, 1819) = 381.36, b = .42, SE = .02, t = 19.53, p < .001, 95% CI [.375, .459]). That is a rather substantial effect; one standard deviation increase in identification with the OSR is related to .42 standard deviation increase in attitude toward community-created content.
@David
I have not released the raw data. I did not state that I might release the raw data in the survey, so I am unlikely to in the future, though I will likely post a full codebook and zero-order correlation table at some point, which would allow some kinds of analyses by others. Also, if you have a particular question, I can do various ad hoc analyses.
Cool, thanks for the brief look Brendan.